
Observability Patterns: Distributed Tracing Across Microservices in AWS
As organizations embrace microservices, requests often hop across dozens of AWS Lambda functions, ECS services, and APIs before completing. Without visibility into this journey, diagnosing latency or failures becomes a guessing game.
Enter distributed tracing — one of the most essential observability patterns in the AWS ecosystem.
What Is Distributed Tracing?
Distributed tracing tracks a request as it flows through multiple services, generating a trace composed of smaller spans. Each span records a segment of work — like a function call or HTTP request — giving engineers the ability to visualize end-to-end performance and pinpoint bottlenecks.
With distributed tracing, you can:
- Understand how services interact.
- Identify high-latency dependencies.
- Detect failed or retried calls.
- Correlate traces with logs and metrics for full-stack observability.
Why Distributed Tracing Matters in AWS
AWS provides native and open-source-friendly solutions for observability. Distributed tracing helps teams:
- Detect performance degradation early.
- Improve service-level objectives (SLOs).
- Correlate telemetry across distributed systems.
- Enhance collaboration between development and operations teams.
Implementing Distributed Tracing in AWS
1. Use AWS X-Ray
AWS X-Ray is the cornerstone of distributed tracing in AWS. It provides a service map that visualizes connections between microservices and highlights latency or error hotspots.
How it works:
- Instrument your application with the AWS X-Ray SDK.
- Each request generates a trace ID that’s propagated across services.
- Data is sent to X-Ray, where you can visualize performance in near real time.
Example (Node.js Lambda):
const AWSXRay = require('aws-xray-sdk-core');
const AWS = AWSXRay.captureAWS(require('aws-sdk'));

exports.handler = async (event) => {
  const s3 = new AWS.S3();
  const result = await s3.listBuckets().promise();
  return result;
};
Best for: Lambda functions, API Gateway, ECS, and EC2-based microservices.
2. Integrate OpenTelemetry with AWS
AWS fully supports OpenTelemetry (OTel) — an open-source observability framework for tracing, metrics, and logs.
By using OpenTelemetry with AWS Distro for OpenTelemetry (ADOT), you can send trace data to AWS X-Ray, CloudWatch, or other tools like Grafana and Datadog.
Example (Python):
from opentelemetry import trace
from opentelemetry.instrumentation.requests import RequestsInstrumentor
from opentelemetry.sdk.trace import TracerProvider
from opentelemetry.sdk.trace.export import BatchSpanProcessor
from aws_xray_sdk.core import xray_recorder
from opentelemetry.exporter.awsxray import AWSXRayIdGenerator, AWSXRayExporter

trace.set_tracer_provider(
    TracerProvider(id_generator=AWSXRayIdGenerator())
)
tracer = trace.get_tracer(__name__)

exporter = AWSXRayExporter()
trace.get_tracer_provider().add_span_processor(BatchSpanProcessor(exporter))
RequestsInstrumentor().instrument()
Key benefits:
- Unified telemetry format across cloud platforms.
- Vendor-neutral instrumentation.
- Automatic context propagation using W3C Trace Context or AWS trace headers.
3. Propagate Trace Context Across AWS Services
When a request flows through API Gateway → Lambda → DynamoDB → S3, trace headers like X-Amzn-Trace-Id or traceparent ensure continuity.
If these headers are not propagated, AWS X-Ray cannot connect spans — resulting in incomplete trace visualization.
Tip: Use the AWS SDK clients wrapped by X-Ray or OTel libraries to automatically propagate context.
4. Visualize and Analyze Traces
AWS provides multiple ways to explore distributed traces:
- AWS X-Ray Console: Displays the service map with real-time performance visualization.
- AWS CloudWatch ServiceLens: Combines metrics, logs, and traces in a single dashboard.
- AWS CloudWatch Logs Insights: Use queries to filter traces and correlate with logs.
- Amazon Managed Grafana: Build custom dashboards to visualize trace and span data.
Best Practices for Distributed Tracing in AWS
- Use consistent trace IDs across all services and layers.
- Enable sampling to control trace data volume and cost.
- Combine CloudWatch Logs, Metrics, and X-Ray traces for full observability.
- Adopt AWS Distro for OpenTelemetry for vendor-neutral flexibility.
- Create alerts in CloudWatch for latency and error thresholds.
When to Choose AWS X-Ray vs. OpenTelemetry
| Use Case | Best Option |
|---|---|
| AWS-native workloads (Lambda, ECS, EC2) | AWS X-Ray |
| Hybrid or multi-cloud environments | OpenTelemetry (ADOT) |
| Advanced custom metrics and external backends | OpenTelemetry + CloudWatch |
Distributed tracing is the connective tissue of observability in AWS.
Whether you use X-Ray or OpenTelemetry, the goal is the same — to gain a clear, end-to-end view of how your microservices behave in production.
With AWS X-Ray, CloudWatch, and OpenTelemetry, you can trace, visualize, and optimize every user journey across your cloud-native ecosystem.
Trace smarter. Debug faster. Build resiliently.
Extra posts:
 Follow the Thread Distributed Tracing Patterns for Microservices in Azure
  Scalability Patterns in the Cloud AWS & Azure Approaches
 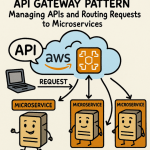 API Gateway Pattern in AWS Managing APIs and Routing Requests to Microservices
 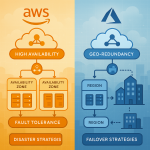 Building Resilient Applications Availability & Resilience Patterns in AWS and Azure
  Patterns vs. Anti-Patterns: The Architectural Compass
 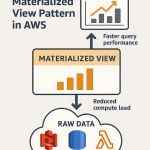 🚀 Materialized View Pattern in AWS Precompute for Performance