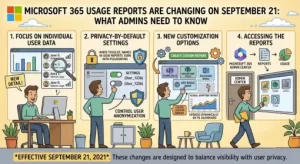
Microsoft 365 administrators should have a new date on their calendars: September 21, 2026.
Microsoft is updating its Microsoft Browser and Visio usage reports as part of a broader effort to improve reporting accuracy and make Microsoft 365 analytics more useful for organizations. While the changes are designed to provide a clearer picture of how applications are being used, administrators may notice something important after the update: active-user numbers could increase.
That does not necessarily mean more people suddenly started using Microsoft 365.
Instead, Microsoft is changing how some of the usage metrics are calculated and classified. The company says the updates are intended to improve reporting accuracy and provide more workload-specific analytics across Microsoft 365 services.
For IT teams, Microsoft 365 administrators, reporting specialists and organizations that rely on Microsoft Graph Reports API data, the change is worth paying attention to.
What is changing in Microsoft 365 usage reports?
The upcoming update affects two areas of Microsoft 365 reporting: Microsoft Browser usage reporting and Visio usage reporting.
Both updates are scheduled to begin on September 21, 2026.
For Microsoft Browser reporting, Microsoft is expanding the applications included in the report. The updated reporting will include additional Microsoft 365 applications, including Microsoft 365 Copilot App, OneNote and Outlook.
That means organizations could see a noticeable change in their reported active-user numbers once the new calculation method takes effect.
The change is primarily about measurement rather than an actual change in user behavior. Administrators comparing reports before and after September 21 should therefore be careful when interpreting sudden increases in usage.
The same principle applies to Visio.
Microsoft says Visio active-user counts may increase following the update. The company is also changing how Visio Desktop and Visio Web usage classifications are handled, which could affect how organizations interpret their Visio analytics.
Why could active-user numbers increase?
For many IT administrators, the biggest question will be simple: Why did the number of active users suddenly go up?
The answer is that Microsoft’s reporting methodology is changing.
Usage reports are based on defined metrics and classifications that determine how activity is counted. When those calculations are updated, the resulting numbers can change even when an organization’s underlying user activity has not changed by the same amount.
This distinction is particularly important for teams that use Microsoft 365 reports for internal dashboards, adoption tracking or management reporting.
For example, an administrator might compare the number of Microsoft Browser active users on September 20 with the number reported on September 22. If the September 22 figure is higher, it would be misleading to automatically interpret that difference as a sudden increase in employee adoption.
The reporting methodology itself has changed.
Microsoft’s update is intended to provide more accurate and workload-specific analytics, so the new figures should be treated as the new reporting baseline.
Historical data will not be recalculated
There is another important detail administrators should understand: Microsoft will not recalculate historical reporting data.
This means existing reports from before the September 21 change will remain based on the previous reporting methodology.
As a result, organizations could end up with two different measurement baselines in their historical reporting.
This matters for anyone maintaining long-term Microsoft 365 adoption dashboards.
Imagine an organization has tracked Microsoft Browser active users for the past 12 months. The historical figures will remain unchanged, while the numbers generated after September 21 will reflect the updated methodology.
A chart showing usage over time could therefore display a visible jump around the update date.
That jump should be documented rather than treated automatically as a genuine adoption event.
Microsoft Browser reporting is expanding
One of the more noticeable changes concerns Microsoft Browser reporting.
The updated report will include additional Microsoft 365 applications, including:
- Microsoft 365 Copilot App
- OneNote
- Outlook
The broader application coverage is intended to give administrators a more complete picture of Microsoft 365 usage.
For organizations with large Microsoft 365 environments, this can make reporting more useful because application activity can be viewed within a broader workload context.
However, it also means that existing dashboards or reports built around the previous definition of Microsoft Browser usage may need to be reviewed.
Organizations should check whether their internal documentation defines exactly what the current Microsoft Browser metric represents. If the definition changes, historical comparisons may require additional explanation.
Visio reporting is also getting a refresh
Visio administrators should also expect changes on September 21.
Microsoft says Visio active-user counts may increase after the update. The company is also updating classifications for Visio Desktop and Visio Web usage.
That could affect organizations that track Visio adoption across different platforms.
For example, an organization may currently separate desktop and web usage in an internal dashboard. After the reporting update, administrators should verify that the classifications returned by Microsoft’s reporting tools still align with their dashboard logic.
This is particularly relevant for organizations using automated reporting.
Microsoft Graph Reports API integrations need attention
The update is not limited to people who manually open reports in the Microsoft 365 admin center.
Organizations that consume usage information programmatically should also review their integrations.
Microsoft specifically identifies organizations using Microsoft Graph Reports API browser usage metrics as potentially affected.
If a company has an automated process that pulls Microsoft 365 usage data into a data warehouse, Power BI dashboard, custom analytics platform or management reporting system, administrators should validate those integrations after the change.
The goal is not necessarily to rebuild the integration. Instead, teams should verify that the metrics being consumed still behave as expected and that any changes in active-user counts are understood.
This is especially important when reports are used for automated alerts or business decisions.
What Microsoft 365 administrators should do now
The update is scheduled for September 21, giving administrators a short window to prepare.
A few practical steps can help reduce confusion.
1. Review existing dashboards
Identify dashboards, reports and spreadsheets that depend on Microsoft Browser or Visio usage metrics.
Pay particular attention to dashboards that display month-over-month or year-over-year adoption figures.
2. Record September 21 as a baseline change
Organizations should document September 21, 2026 as a reporting methodology change date.
Adding a note to internal dashboards can help future analysts understand why a sudden change appears in the data.
3. Check API integrations
If your organization uses Microsoft Graph Reports API data, verify that automated reporting continues to produce the expected fields and values.
Teams should pay particular attention to browser usage metrics and any logic that depends on active-user counts.
4. Avoid treating the increase as immediate adoption
If active-user numbers increase after September 21, don’t automatically interpret that as a sudden change in employee behavior.
First determine whether the difference is related to Microsoft’s updated reporting calculations.
5. Update internal documentation
IT teams should consider updating documentation that explains Microsoft Browser and Visio usage metrics.
This is particularly useful for organizations where Microsoft 365 analytics are shared with executives, department managers or business teams.
What this means for Microsoft 365 analytics
The bigger picture is that Microsoft is continuing to refine the way Microsoft 365 usage is measured and presented.
Accurate reporting is important because organizations increasingly use Microsoft 365 analytics to understand application adoption, identify usage patterns and make decisions about their technology environments.
However, improved measurement can sometimes create short-term confusion when reporting definitions change.
The key issue for administrators is therefore context.
A change in the number shown in a report does not always represent a change in the underlying behavior of users. Sometimes it represents a change in the way that behavior is measured.
The September 21 update is a good example.
Microsoft Browser and Visio reports are getting updated calculations and classifications, while historical data will remain as it was. Organizations that understand this distinction will be better positioned to interpret their reports correctly.
The bottom line
Microsoft’s September 21, 2026 update to Microsoft Browser and Visio usage reports is primarily about improving reporting accuracy and expanding the scope of Microsoft 365 analytics.
The most important takeaway for administrators is that active-user numbers may increase after the update, while historical data will not be recalculated.
Organizations should therefore treat September 21 as a new reporting baseline, review dashboards that depend on affected metrics and validate Microsoft Graph Reports API integrations.
For IT teams, this is a relatively straightforward reporting change — but documenting it now can prevent confusion later when someone looks at a usage chart and asks why the numbers suddenly moved.
In short, the numbers may change, but that does not necessarily mean your users changed their behavior. The measurement changed first.
Extra posts:
 Microsoft Copilot Cost Management Gets a Major September 2026 Upgrade: What Admins Need to Know
  Microsoft Changes Copilot Email Sender: What Microsoft 365 Admins Need to Know
  Microsoft 365’s New Hero Link Is Changing How Teams Share Files
  Microsoft 365 Service Disruption Hits Multiple Services: What Users and Businesses Need to Know on September 2, 2026
  Accessibility Features in Microsoft 365 That Most Admins Forget to Enable
  Microsoft Teams Adds Mandatory Participant Consent Before Meetings: What Admins Need to Know